This is an old revision of the document!
Table of Contents
Worked example:
Data and data source:
In this example we use gene expression data from NSCLC HCC4006 (EGFRm), downloaded from GSE57156.
Steps:
- Log in PathAct. Figure 1 shows the main webpage and how to access.
Figure 1: A: Welcome screen of PathAct: I ) Start box. II ) Login box. III ) Sign up button. IV ) Help pages. B: Screenshot from login box (marked with II). C: Screenshot from sign up box. D: Help menu.
- Load example 2 by pressing Load example file 2 button from the Expression matrix files panel. Once loaded, click on the pathact_example_2.txt button and load it. Figure 2 shows the overview of the PathAct working page.
Figure 2: Overview of PathAct. A: Profile section. B: Expression matrix files panel (allows load and select data files). C: CellMaps visualizer. An interactive visualizer that shows the pathways and perturbations. D: Pathway list. E: Gene list panel. It allows customize the activity of the node. F: Circuit list for a given pathway. G: Drug targets panel (only for drug assisted functionality). It shows the side effect of selected drugs. H: Related drug list panel. Once selected a gene, PathAct propose drugs with the same target. Configure target actions button allows customize the impact of drug effect. I: Last update gene list panel. A list showing the last gene modifications.
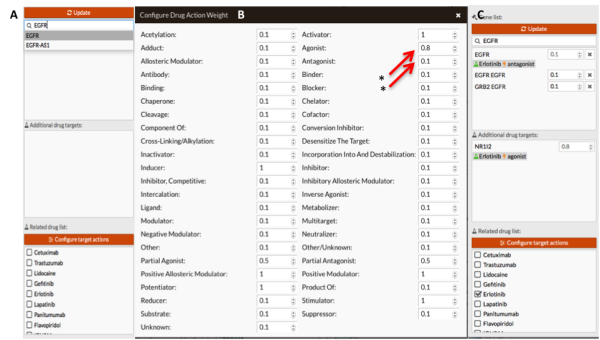
- In this example we simulate the effect of treating cells with Erlotinib (FDA approved EGFR inhibitor for treatment of NSCLC EGFR mutant). We modify the target actions fixing: Agonist = 0.8 and Antagonist = 0.1 (mechanisms of action of Erlotinib on its targets). Figure 3 shows how modify the expression of those genes.
Figure 3: Gene signal modification. A: Screenshot of gene selection panel. Note how the drug list appears when we select any gene. B: We modify the effect of drug action on its targets (in our case, agonist and antagonist, mark with red arrow and stars). C: Screenshot of gene selection panel after In Silico treatment with erlotinib. We have had to manually modify the expression of “EGFR - EGFR node” and “GRB2 EGFR node” because the drug annotations doesn't contain those targets.
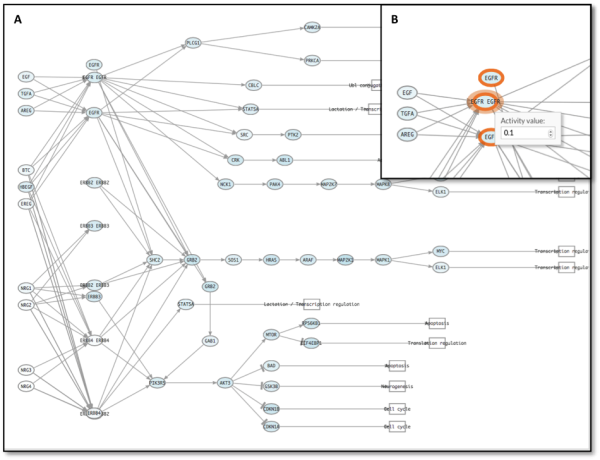
CellMaps visualizer highlights modified genes to help locate them (figure 4).
Figure 4: A: ErbB signaling pathway. B: Detail of EGFR modification on the pathway. Note how CellMaps marks perturbed genes.
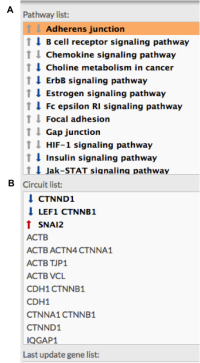
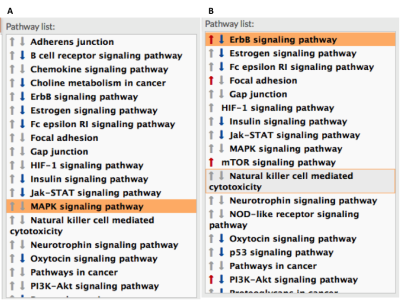
- Perform the inhibition by pressing update button. Those pathways and circuits that have been modified are marked in bold. Red or blue arrows indicate if those changes are or not significant (overactivated path or repressed).
Figure 5: Pathway list aspect after perturbation. The panel marks those pathways (A) and circuits (B) which activation has been modified (bold). Significant modification is marked with red upwards arrows (over activity) and blue down arrows (repression).
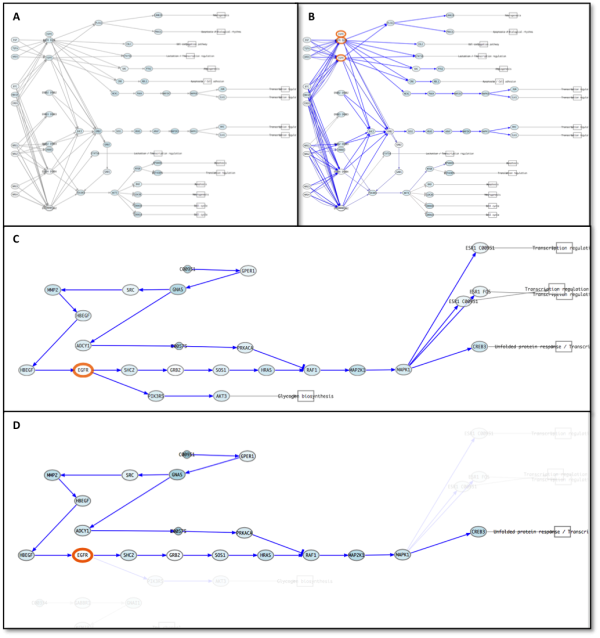
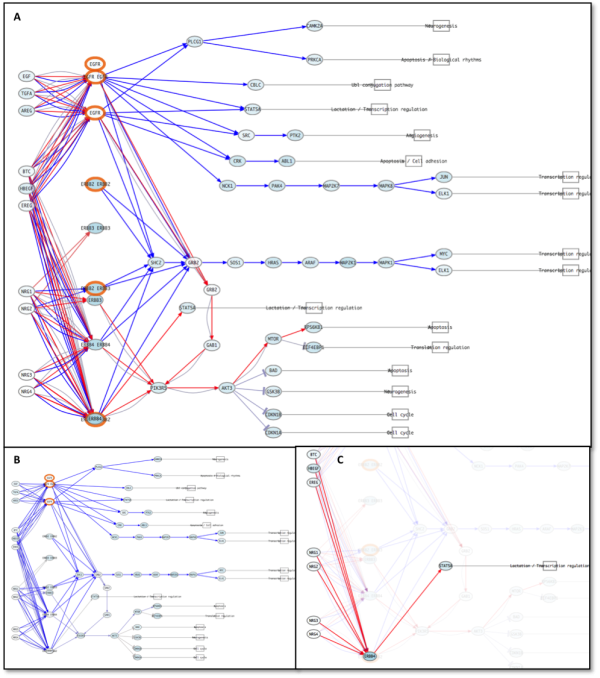
Pathways appear painted with red or blue connecting lines in the visualizer. In our example all lines are blue because our inhibition reduce the active level of all the circuit (figure 6). We show how EGFR inhibition ends in alteration of transcriptional programs that in our example stop cell growth.
Figure 6: ErbB signaling pathway previous the perturbation (A) and after (B). Significant repressed circuits are painted in blue. C: Detail of Estrogen signaling pathway. D: CREB3 circuit of Estrogen signaling pathway. Note how the circuit selection helps to visualize correctly the perturbed system.
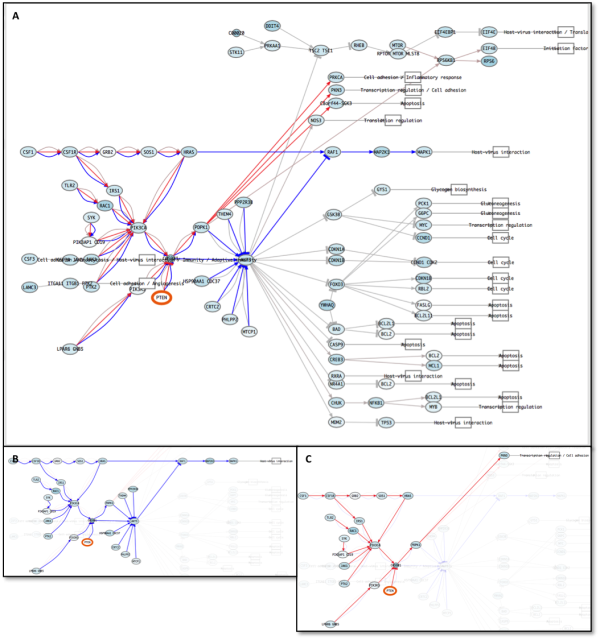
- PathAct allows step by step perturbations. In our example we show Erlotinib resistance acquisition by a typical way, PTEN loss and constitutive activation of HER2 (ERBB2). Figure 7 shows how system respond to alteration. The visualization of different paths remains simple and is showed in figures 8 and 9. Furthermore, circuit selection simplify user how the signal are propagated.
Figure 7: ErbB signaling pathway after the treatment with Erlotinib (A) and after adaptation (PTEN loss and HER2 activating mutation - B).
Figure 8: A: ErbB signaling pathway after the resistance acquisition to the treatment and previously (B). C: SAT5A circuit of ErbB signaling pathway. Note how by circuit visualization helps the interpretation.
Figure 9: A: PI3K - Akt signaling pathway after second perturbation (resistance acquired to EGFR inhibitor). B: MAPK1 circuit of PI3K - Akt signaling pathway. Note how MAPK circuits are repressed and mTOR circuits are activated. C: C8orf44-SGK3 circuit of PI3K - Akt signaling pathway. Note how by circuit visualization helps the interpretation.
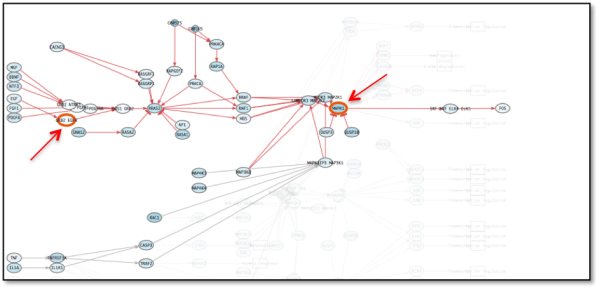
- Activating ERK mutations constitutes another important mechanism of resistance to EGFR inhibitors. Figure 10 shows how constant activation of ERK (MAPK1) offset EGFR inhibition and MAPK pathway is restored.
Figure 10: A: MAPK signaling pathway after second perturbation (resistance acquired to EGFR inhibitor by ERK activating mutation). Note how the circuit remains activated although EGFR remains inhibited.
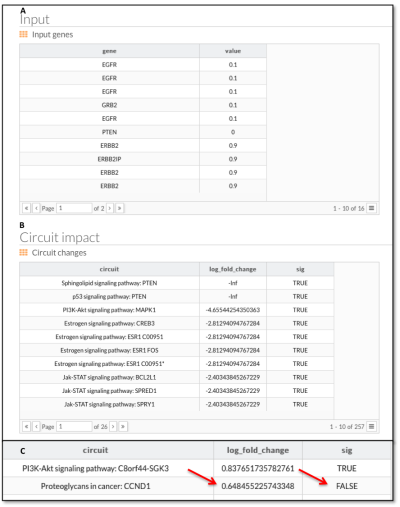
- Finally, PathAct reports (figure 11) all the gene signal alterations and circuits log fold change, discriminating between significant or not (absolute FC > 2).
Figure 11: PathAct report. A: list of perturbed genes and final value of activation. B: ranked circuits by log fold change (base 10). Note how PTEN logFC are -Infinite (PTEN loss represents a complete depletion of PTEN - complete node inactivation). C: Fold change is used by calculate significance using 2 as threshold (loge2 = 0.6931472).


